|
|||||||


|

|
|
 |
|
|
Strumenti |
 23-03-2013, 12:40
|
#2341 |
|
Senior Member
Iscritto dal: Jan 2010
Messaggi: 37003
|
Hai controllato in mosconfig che non ci siano processi associati alla scheda video, come pannelli di controllo, utility, ecc.
|

|

|
|
23-03-2013, 12:56
|
#2342 |
|
Senior Member
Iscritto dal: Jul 2012
Città: Bologna
Messaggi: 8123
|
Ho disabilitato un certo AMD external events utility, anche se boh mi pare strano. Vedo se riesco a provare un'altra scheda video dal mio amico (una gtx 660ti).
__________________
AMD Ryzen 5700x|Msi B350 Mortar|Corsair Vengeance lpx 4x8gb 3200|Gigabyte rtx 4070 Gaming OC|xfx 750w black edition|Samsung 980 pro 512gb+SiliconPower 512gb+Toshiba P300 3tb+WD Blue 1tb|Cooler Master MasterCase pro 3|AOC 27G2U||| |
|
|
|
|
23-03-2013, 17:07
|
#2344 |
|
Senior Member
Iscritto dal: Jul 2012
Città: Bologna
Messaggi: 8123
|
Guarda è da mesi ormai che va avanti la cosa, penso che gli ultimi li avevo già messi. Dai 13.1 odierni a quelli prima, cmq proverò sta settimana a farmi passare le ram dal mio amico, e rimettere il mio alimentatore dato che il problema non è sembrato quello e vedo come va. Se continua proverò con la sua scheda video
__________________
AMD Ryzen 5700x|Msi B350 Mortar|Corsair Vengeance lpx 4x8gb 3200|Gigabyte rtx 4070 Gaming OC|xfx 750w black edition|Samsung 980 pro 512gb+SiliconPower 512gb+Toshiba P300 3tb+WD Blue 1tb|Cooler Master MasterCase pro 3|AOC 27G2U||| |
|
|
|
|
23-03-2013, 20:19
|
#2345 |
|
Senior Member
Iscritto dal: Jul 2012
Città: Bologna
Messaggi: 8123
|
Uppo solo per dirvi che al mio amico ha appena fatto una bsod dal nulla con le mie ram. Cmq appena le ho tolte dalla mobo mi sono accorto che devono andare a 1.65v secondo me è quello...
Inviato dal mio HTC Sensation Z710e con Tapatalk 2
__________________
AMD Ryzen 5700x|Msi B350 Mortar|Corsair Vengeance lpx 4x8gb 3200|Gigabyte rtx 4070 Gaming OC|xfx 750w black edition|Samsung 980 pro 512gb+SiliconPower 512gb+Toshiba P300 3tb+WD Blue 1tb|Cooler Master MasterCase pro 3|AOC 27G2U||| |
|
|
|
|
24-03-2013, 15:59
|
#2346 |
|
Senior Member
Iscritto dal: Feb 2005
Città: Enna Sicilia
Messaggi: 456
|
Ho scaricato l'ultimo debugger,
i simboli sono per Windws 7 Sp1 X64 (Windows 7 Service Pack 1 x64 retail symbols, all languages(File size: 287 MB)) I simboli non mi funzionano, quindi ho utilizzato il percorso: SRV*c:\Windows\symbols*http://msdl.microsoft.com/download/symbols Facendo l'analisi dei minidump, il file incriminato è ntkrnlmp.exe I Processi nei vari dump cambiano: PROCESS_NAME: taskhost.exe - svchost.exe - chrome.exe La mia configurazione Intel i5 2400 Asrock Z68 Pro 3 RAM: 2x2GB Excelram PC 3 - 12800 , 1,65V 6-9-9-24 Video PCI Ex: Ati HD6700 Non ciò capito mica molto da sti dump Codice:
WARNING: Inaccessible path: 'D:\Symbols'

Microsoft (R) Windows Debugger Version 6.2.9200.20512 AMD64
Copyright (c) Microsoft Corporation. All rights reserved.


Loading Dump File [C:\Windows\Minidump\032313-17752-01.dmp]
Mini Kernel Dump File: Only registers and stack trace are available

WARNING: Inaccessible path: 'D:\Symbols'
Symbol search path is: SRV*c:\Windows\symbols*http://msdl.microsoft.com/download/symbols;D:\Symbols
Executable search path is:
Windows 7 Kernel Version 7601 (Service Pack 1) MP (4 procs) Free x64
Product: WinNt, suite: TerminalServer SingleUserTS
Built by: 7601.18044.amd64fre.win7sp1_gdr.130104-1431
Machine Name:
Kernel base = 0xfffff800`02e53000 PsLoadedModuleList = 0xfffff800`03097670
Debug session time: Sat Mar 23 17:17:43.638 2013 (UTC + 1:00)
System Uptime: 0 days 0:06:29.856
Loading Kernel Symbols
...............................................................
................................................................
.............................
Loading User Symbols
Loading unloaded module list
...
*******************************************************************************
*                                                                             *
*                        Bugcheck Analysis                                    *
*                                                                             *
*******************************************************************************

Use !analyze -v to get detailed debugging information.

BugCheck 1A, {41790, fffffa800223b6c0, ffff, 0}

Probably caused by : ntkrnlmp.exe ( nt! ?? ::FNODOBFM::`string'+35084 )

Followup: MachineOwner
---------

1: kd> !analyze -v
*******************************************************************************
*                                                                             *
*                        Bugcheck Analysis                                    *
*                                                                             *
*******************************************************************************

MEMORY_MANAGEMENT (1a)
    # Any other values for parameter 1 must be individually examined.
Arguments:
Arg1: 0000000000041790, A page table page has been corrupted. On a 64 bit OS, parameter 2
	contains the address of the PFN for the corrupted page table page.
	On a 32 bit OS, parameter 2 contains a pointer to the number of used
	PTEs, and parameter 3 contains the number of used PTEs.
Arg2: fffffa800223b6c0
Arg3: 000000000000ffff
Arg4: 0000000000000000

Debugging Details:
------------------


BUGCHECK_STR:  0x1a_41790

CUSTOMER_CRASH_COUNT:  1

DEFAULT_BUCKET_ID:  WIN7_DRIVER_FAULT

PROCESS_NAME:  taskhost.exe

CURRENT_IRQL:  0

LAST_CONTROL_TRANSFER:  from fffff80002f39e10 to fffff80002ec8c40

STACK_TEXT:
fffff880`0a5b2818 fffff800`02f39e10 : 00000000`0000001a 00000000`00041790 fffffa80`0223b6c0 00000000`0000ffff : nt!KeBugCheckEx
fffff880`0a5b2820 fffff800`02eb542f : fffffa80`00000000 00000000`2583ffff 00000000`00000000 00000000`00000000 : nt! ?? ::FNODOBFM::`string'+0x35084
fffff880`0a5b29e0 fffff800`02ec7ed3 : ffffffff`ffffffff 00000000`02a3f738 00000000`02a3f730 00000000`00008000 : nt!NtFreeVirtualMemory+0x61f
fffff880`0a5b2ae0 00000000`774f14fa : 00000000`00000000 00000000`00000000 00000000`00000000 00000000`00000000 : nt!KiSystemServiceCopyEnd+0x13
00000000`02a3f6f8 00000000`00000000 : 00000000`00000000 00000000`00000000 00000000`00000000 00000000`00000000 : 0x774f14fa


STACK_COMMAND:  kb

FOLLOWUP_IP:
nt! ?? ::FNODOBFM::`string'+35084
fffff800`02f39e10 cc              int     3

SYMBOL_STACK_INDEX:  1

SYMBOL_NAME:  nt! ?? ::FNODOBFM::`string'+35084

FOLLOWUP_NAME:  MachineOwner

MODULE_NAME: nt

IMAGE_NAME:  ntkrnlmp.exe

DEBUG_FLR_IMAGE_TIMESTAMP:  50e79935

FAILURE_BUCKET_ID:  X64_0x1a_41790_nt!_??_::FNODOBFM::_string_+35084

BUCKET_ID:  X64_0x1a_41790_nt!_??_::FNODOBFM::_string_+35084

Followup: MachineOwner
Codice:
Loading Dump File [C:\Windows\Minidump\032313-31371-01.dmp]
Mini Kernel Dump File: Only registers and stack trace are available

WARNING: Inaccessible path: 'D:\Symbols'
Symbol search path is: SRV*c:\Windows\symbols*http://msdl.microsoft.com/download/symbols;D:\Symbols
Executable search path is:
Windows 7 Kernel Version 7601 (Service Pack 1) MP (4 procs) Free x64
Product: WinNt, suite: TerminalServer SingleUserTS
Built by: 7601.18044.amd64fre.win7sp1_gdr.130104-1431
Machine Name:
Kernel base = 0xfffff800`02e5c000 PsLoadedModuleList = 0xfffff800`030a0670
Debug session time: Sat Mar 23 19:17:55.514 2013 (UTC + 1:00)
System Uptime: 0 days 0:05:40.731
Loading Kernel Symbols
...............................................................
................................................................
.............................
Loading User Symbols
Loading unloaded module list
...
*******************************************************************************
*                                                                             *
*                        Bugcheck Analysis                                    *
*                                                                             *
*******************************************************************************

Use !analyze -v to get detailed debugging information.

BugCheck 1A, {41201, fffff68000079c48, ef600000b315a867, fffffa8003c6e010}

Probably caused by : ntkrnlmp.exe ( nt! ?? ::FNODOBFM::`string'+13702 )

Followup: MachineOwner
---------

3: kd> !analyze -v
*******************************************************************************
*                                                                             *
*                        Bugcheck Analysis                                    *
*                                                                             *
*******************************************************************************

MEMORY_MANAGEMENT (1a)
    # Any other values for parameter 1 must be individually examined.
Arguments:
Arg1: 0000000000041201, The subtype of the bugcheck.
Arg2: fffff68000079c48
Arg3: ef600000b315a867
Arg4: fffffa8003c6e010

Debugging Details:
------------------


BUGCHECK_STR:  0x1a_41201

CUSTOMER_CRASH_COUNT:  1

DEFAULT_BUCKET_ID:  WIN7_DRIVER_FAULT

PROCESS_NAME:  svchost.exe

CURRENT_IRQL:  0

LAST_CONTROL_TRANSFER:  from fffff80002f2dabe to fffff80002ed1c40

STACK_TEXT:
fffff880`08ded878 fffff800`02f2dabe : 00000000`0000001a 00000000`00041201 fffff680`00079c48 ef600000`b315a867 : nt!KeBugCheckEx
fffff880`08ded880 fffff800`02e9cb91 : 00000000`00000000 fffff800`02e9c8f7 00000000`00000010 ef600000`b315a867 : nt! ?? ::FNODOBFM::`string'+0x13702
fffff880`08ded8c0 fffff800`02e9c82a : fffffa80`03c6e010 fffffa80`088efb30 fffffa80`088efb30 00000000`0f389000 : nt!MiQueryAddressState+0x2b1
fffff880`08ded910 fffff800`031aec74 : fffff880`00000004 00000000`0f38a000 fffffa80`03c6e010 fffff680`00000000 : nt!MiQueryAddressSpan+0xaa
fffff880`08ded980 fffff800`02ed0ed3 : 00000000`000001a0 fffffa80`0429f640 fffff880`08deda88 00000000`0021aba8 : nt!NtQueryVirtualMemory+0x382
fffff880`08deda70 00000000`7713154a : 00000000`00000000 00000000`00000000 00000000`00000000 00000000`00000000 : nt!KiSystemServiceCopyEnd+0x13
00000000`0021ab88 00000000`00000000 : 00000000`00000000 00000000`00000000 00000000`00000000 00000000`00000000 : 0x7713154a


STACK_COMMAND:  kb

FOLLOWUP_IP:
nt! ?? ::FNODOBFM::`string'+13702
fffff800`02f2dabe cc              int     3

SYMBOL_STACK_INDEX:  1

SYMBOL_NAME:  nt! ?? ::FNODOBFM::`string'+13702

FOLLOWUP_NAME:  MachineOwner

MODULE_NAME: nt

IMAGE_NAME:  ntkrnlmp.exe

DEBUG_FLR_IMAGE_TIMESTAMP:  50e79935

FAILURE_BUCKET_ID:  X64_0x1a_41201_nt!_??_::FNODOBFM::_string_+13702

BUCKET_ID:  X64_0x1a_41201_nt!_??_::FNODOBFM::_string_+13702

Followup: MachineOwner
---------
Codice:
Loading Dump File [C:\Windows\Minidump\032413-24351-01.dmp]
Mini Kernel Dump File: Only registers and stack trace are available

WARNING: Inaccessible path: 'D:\Symbols'
Symbol search path is: SRV*c:\Windows\symbols*http://msdl.microsoft.com/download/symbols;D:\Symbols
Executable search path is:
Windows 7 Kernel Version 7601 (Service Pack 1) MP (4 procs) Free x64
Product: WinNt, suite: TerminalServer SingleUserTS
Built by: 7601.18044.amd64fre.win7sp1_gdr.130104-1431
Machine Name:
Kernel base = 0xfffff800`02e59000 PsLoadedModuleList = 0xfffff800`0309d670
Debug session time: Sun Mar 24 12:11:06.966 2013 (UTC + 1:00)
System Uptime: 0 days 0:07:29.794
Loading Kernel Symbols
...............................................................
................................................................
.............................
Loading User Symbols
Loading unloaded module list
.........
*******************************************************************************
*                                                                             *
*                        Bugcheck Analysis                                    *
*                                                                             *
*******************************************************************************

Use !analyze -v to get detailed debugging information.

BugCheck 1A, {41201, fffff680003baf48, 5ff000007896d025, fffffa8003f11560}

Probably caused by : ntkrnlmp.exe ( nt! ?? ::FNODOBFM::`string'+13702 )

Followup: MachineOwner
---------

1: kd> !analyze -v
*******************************************************************************
*                                                                             *
*                        Bugcheck Analysis                                    *
*                                                                             *
*******************************************************************************

MEMORY_MANAGEMENT (1a)
    # Any other values for parameter 1 must be individually examined.
Arguments:
Arg1: 0000000000041201, The subtype of the bugcheck.
Arg2: fffff680003baf48
Arg3: 5ff000007896d025
Arg4: fffffa8003f11560

Debugging Details:
------------------


BUGCHECK_STR:  0x1a_41201

CUSTOMER_CRASH_COUNT:  1

DEFAULT_BUCKET_ID:  WIN7_DRIVER_FAULT

PROCESS_NAME:  chrome.exe

CURRENT_IRQL:  0

LAST_CONTROL_TRANSFER:  from fffff80002f2aabe to fffff80002ecec40

STACK_TEXT:
fffff880`08b23878 fffff800`02f2aabe : 00000000`0000001a 00000000`00041201 fffff680`003baf48 5ff00000`7896d025 : nt!KeBugCheckEx
fffff880`08b23880 fffff800`02e99b91 : fffff880`08b238d0 00000000`00000000 fffffa80`04708320 5ff00000`7896d025 : nt! ?? ::FNODOBFM::`string'+0x13702
fffff880`08b238c0 fffff800`02e997f3 : fffffa80`03f11560 fffffa80`0452eb30 fffffa80`0452eb30 00000000`775e9000 : nt!MiQueryAddressState+0x2b1
fffff880`08b23910 fffff800`031abc74 : 00000000`00000000 00000000`775ea000 fffffa80`03f11560 00000000`00000000 : nt!MiQueryAddressSpan+0x73
fffff880`08b23980 fffff800`02ecded3 : ffffffff`ffffffff fffffa80`04670b50 00000000`00000000 00000000`004ee308 : nt!NtQueryVirtualMemory+0x382
fffff880`08b23a70 00000000`77c3154a : 00000000`00000000 00000000`00000000 00000000`00000000 00000000`00000000 : nt!KiSystemServiceCopyEnd+0x13
00000000`004ee2e8 00000000`00000000 : 00000000`00000000 00000000`00000000 00000000`00000000 00000000`00000000 : 0x77c3154a


STACK_COMMAND:  kb

FOLLOWUP_IP:
nt! ?? ::FNODOBFM::`string'+13702
fffff800`02f2aabe cc              int     3

SYMBOL_STACK_INDEX:  1

SYMBOL_NAME:  nt! ?? ::FNODOBFM::`string'+13702

FOLLOWUP_NAME:  MachineOwner

MODULE_NAME: nt

IMAGE_NAME:  ntkrnlmp.exe

DEBUG_FLR_IMAGE_TIMESTAMP:  50e79935

FAILURE_BUCKET_ID:  X64_0x1a_41201_nt!_??_::FNODOBFM::_string_+13702

BUCKET_ID:  X64_0x1a_41201_nt!_??_::FNODOBFM::_string_+13702

Followup: MachineOwner
---------
__________________
Mercatino: Utenti OK: Kaiser76, Bobosassa, veltosaar; |
|
|
|
|
24-03-2013, 16:31
|
#2347 | |
|
Senior Member
Iscritto dal: Jul 2010
Messaggi: 9326
|
Quote:
IMHO o cambi RAM prendendo un kit compatibile con le specifiche del tuo sistema o adatti le RAM che già hai al tuo sistema riducendo la frequenza e aumentando i timings finché non diventano stabili.
__________________
[CASE Cooler Master Silencio 550]-[MOBO Asrock Z68 Pro3]-[CPU Intel Core i7-2600K]-[RAM 8GB G.Skill]-[HDD 1TB Samsung + 320GB Samsung + 500GB Maxtor]-[VGA Zotac Geforce GTX 560 Ti]-[MASTERIZZATORE Samsung SH-S222AB][S.O. Windows 7 64 bit] |
|
|
|
|

|
24-03-2013, 16:42
|
#2348 | |
|
Senior Member
Iscritto dal: Jul 2010
Messaggi: 9326
|
Quote:
La causa dovrebbe essere tra queste: 1. problemi software. Se hai formattato ( e chiedo conferma ) possiamo escluderli. 2. problemi di uno o più banchi di ram. Testa i moduli sia singolarmente sia in coppia con memtest86+ (da cd di boot). Fai 4/5 pass. 3. problemi di uno o più slot ram. Anche questo puoi verificarlo con Memtest. 4. problemi di configurazione della ram nel BIOS. Se le impostazioni della RAM sono settate su AUTO o su (by SPD) è possibile che il sistema ha messo in automatico valori che la tua config non riesce a reggere. Quindi setta timings, voltaggio e frequenze manualmente inserendo i valori riportati sul sito del produttore. 5. alimentazione instabile. Prova a cambiare alimentatore, sostituendolo con uno sicuramente funzionante. 6. problemi di scheda madre (o memory controller). Poi qualche domanda: la configurazione del PC? ottieni schermate blu frequentemente? prova anche ad usare una live linux (es. Ubuntu o Mint) per un po' di tempo, per capire se il problema è di Windows (se linux non dà problemi) o hardware (se anche linux dà problemi). ciao
__________________
[CASE Cooler Master Silencio 550]-[MOBO Asrock Z68 Pro3]-[CPU Intel Core i7-2600K]-[RAM 8GB G.Skill]-[HDD 1TB Samsung + 320GB Samsung + 500GB Maxtor]-[VGA Zotac Geforce GTX 560 Ti]-[MASTERIZZATORE Samsung SH-S222AB][S.O. Windows 7 64 bit] |
|
|
|
|
|
24-03-2013, 17:00
|
#2349 | |
|
Senior Member
Iscritto dal: Jul 2012
Città: Bologna
Messaggi: 8123
|
Quote:
 A parte gli scherzi vi aggiorno se dopo il cambio avrò ancora problemi
__________________
AMD Ryzen 5700x|Msi B350 Mortar|Corsair Vengeance lpx 4x8gb 3200|Gigabyte rtx 4070 Gaming OC|xfx 750w black edition|Samsung 980 pro 512gb+SiliconPower 512gb+Toshiba P300 3tb+WD Blue 1tb|Cooler Master MasterCase pro 3|AOC 27G2U||| |
|
|
|
|
|
25-03-2013, 20:21
|
#2350 | ||||||
|
Senior Member
Iscritto dal: Feb 2005
Città: Enna Sicilia
Messaggi: 456
|
C'è un problema con la gestione della memoria.
La causa dovrebbe essere tra queste: 1. problemi software. Se hai formattato ( e chiedo conferma ) possiamo [/quote]escluderli. Si, ho formattato. Quote:
Quote:
Ora verifico nel Bios che dice Quote:
Quote:
Poi qualche domanda: Quote:
Asrock Z68 Pro 2x2Gb Exceleram Quote:
Molte Grazie, ti faccio sapere a breve Intanto ti posto anche un'ultima schermata blu differente dalle altre, è avvenuta mentre con TuneUp Utilities stavo disattivando Google Chrome. Codice:
Microsoft (R) Windows Debugger Version 6.2.9200.20512 AMD64
Copyright (c) Microsoft Corporation. All rights reserved.


Loading Dump File [C:\Windows\Minidump\032513-17830-01.dmp]
Mini Kernel Dump File: Only registers and stack trace are available

Symbol search path is: SRV*c:\Windows\symbols*http://msdl.microsoft.com/download/symbols
Executable search path is:
Windows 7 Kernel Version 7601 (Service Pack 1) MP (4 procs) Free x64
Product: WinNt, suite: TerminalServer SingleUserTS
Built by: 7601.18044.amd64fre.win7sp1_gdr.130104-1431
Machine Name:
Kernel base = 0xfffff800`02e08000 PsLoadedModuleList = 0xfffff800`0304c670
Debug session time: Mon Mar 25 20:38:03.751 2013 (UTC + 1:00)
System Uptime: 0 days 0:43:53.970
Loading Kernel Symbols
...............................................................
................................................................
...............................
Loading User Symbols
Loading unloaded module list
........
*******************************************************************************
*                                                                             *
*                        Bugcheck Analysis                                    *
*                                                                             *
*******************************************************************************

Use !analyze -v to get detailed debugging information.

BugCheck 4E, {99, 4d2e1, 2, 3eee0}

Probably caused by : memory_corruption ( nt!MiBadShareCount+4c )

Followup: MachineOwner
---------

3: kd> !analyze -v
*******************************************************************************
*                                                                             *
*                        Bugcheck Analysis                                    *
*                                                                             *
*******************************************************************************

PFN_LIST_CORRUPT (4e)
Typically caused by drivers passing bad memory descriptor lists (ie: calling
MmUnlockPages twice with the same list, etc).  If a kernel debugger is
available get the stack trace.
Arguments:
Arg1: 0000000000000099, A PTE or PFN is corrupt
Arg2: 000000000004d2e1, page frame number
Arg3: 0000000000000002, current page state
Arg4: 000000000003eee0, 0

Debugging Details:
------------------


BUGCHECK_STR:  0x4E_99

CUSTOMER_CRASH_COUNT:  1

DEFAULT_BUCKET_ID:  WIN7_DRIVER_FAULT

PROCESS_NAME:  chrome.exe

CURRENT_IRQL:  2

LAST_CONTROL_TRANSFER:  from fffff80002f0cbfc to fffff80002e7dc40

STACK_TEXT:
fffff880`09817e18 fffff800`02f0cbfc : 00000000`0000004e 00000000`00000099 00000000`0004d2e1 00000000`00000002 : nt!KeBugCheckEx
fffff880`09817e20 fffff800`02e29ed0 : 00000000`00000000 fffff680`000029d0 00000000`00000002 00000000`00000001 : nt!MiBadShareCount+0x4c
fffff880`09817e60 fffff800`02e4d7f3 : fffffa80`03d896a0 fffff700`000018ea 0000007f`fffffff8 fffff8a0`0526b158 : nt! ?? ::FNODOBFM::`string'+0x32418
fffff880`09817ef0 fffff800`02e4e8ce : fffffa80`03d896a0 fffffa80`00000000 fffff880`00000b78 fffff800`00000000 : nt!MiDeleteAddressesInWorkingSet+0x307
fffff880`098187a0 fffff800`0315605a : fffff8a0`0b2a4a70 fffff880`09818ae0 00000000`00000000 fffffa80`042bfb50 : nt!MmCleanProcessAddressSpace+0x96
fffff880`098187f0 fffff800`0313c15d : 00000000`00000000 00000000`00000001 00000000`7ef9e000 fffffa80`0427cb50 : nt!PspExitThread+0x56a
fffff880`098188f0 fffff800`02e7075a : 00000000`00000100 fffffa80`042bfc10 00000000`00000001 fffff800`02e7385d : nt!PsExitSpecialApc+0x1d
fffff880`09818920 fffff800`02e70aa0 : 00000000`00000246 fffff880`098189a0 fffff800`0313c0d0 00000000`00000001 : nt!KiDeliverApc+0x2ca
fffff880`098189a0 fffff800`02e7cf77 : fffffa80`042bfb50 00000000`00000234 00000000`00000000 fffffa80`072e2bd0 : nt!KiInitiateUserApc+0x70
fffff880`09818ae0 00000000`73ec2e09 : 00000000`00000000 00000000`00000000 00000000`00000000 00000000`00000000 : nt!KiSystemServiceExit+0x9c
00000000`0427ee98 00000000`00000000 : 00000000`00000000 00000000`00000000 00000000`00000000 00000000`00000000 : 0x73ec2e09


STACK_COMMAND:  kb

FOLLOWUP_IP:
nt!MiBadShareCount+4c
fffff800`02f0cbfc cc              int     3

SYMBOL_STACK_INDEX:  1

SYMBOL_NAME:  nt!MiBadShareCount+4c

FOLLOWUP_NAME:  MachineOwner

MODULE_NAME: nt

DEBUG_FLR_IMAGE_TIMESTAMP:  50e79935

IMAGE_NAME:  memory_corruption

FAILURE_BUCKET_ID:  X64_0x4E_99_nt!MiBadShareCount+4c

BUCKET_ID:  X64_0x4E_99_nt!MiBadShareCount+4c

Followup: MachineOwner
---------
__________________
Mercatino: Utenti OK: Kaiser76, Bobosassa, veltosaar; |
||||||
|
|
|
|
25-03-2013, 22:34
|
#2351 |
|
Senior Member
Iscritto dal: Feb 2005
Città: Enna Sicilia
Messaggi: 456
|
Dunque, ho effettuato il Test col Boot di MemTest 4.20 (Ultima versione),
per un ora e mezza, 3 Passate, Nessun Errore. Sul Bios le impostazioni della RAM erano impostate in AUTO, anche se mi comparivano i valori scelti ed erano Corretti, tranne per il primo valore delle Latenze. La mie RAM sono 6-9-9-24, nel BIOS erano impostate 9-9-9-24 (Che in teoria dovrebbero essere dei valori meno stressanti.., quindi boh) Sono impostate a 1333 Mhz a 1,65V Exceleram ER3006A 2x2GB PC 3-1280 Anche se CPU-Z mi da queste INFO  dove noto che il voltaggio a 1,65V va con una freqenza di 800Mhz (1600Mhz??) Mentre attualmente, siamo ad una frequenza di 1333 con 1,65V (Migliorativo??), centra qualcosa?? Grazie Mille P.S. posto l'ennessima Schermata Blu. Stavo Navigando Codice:
......
*******************************************************************************
*                                                                             *
*                        Bugcheck Analysis                                    *
*                                                                             *
*******************************************************************************

Use !analyze -v to get detailed debugging information.

BugCheck 1A, {41284, c51e001, 5878, fffff70001080000}

Probably caused by : ntkrnlmp.exe ( nt! ?? ::FNODOBFM::`string'+4ad3 )

Followup: MachineOwner
---------

1: kd> !analyze -v
*******************************************************************************
*                                                                             *
*                        Bugcheck Analysis                                    *
*                                                                             *
*******************************************************************************

MEMORY_MANAGEMENT (1a)
    # Any other values for parameter 1 must be individually examined.
Arguments:
Arg1: 0000000000041284, A PTE or the working set list is corrupt.
Arg2: 000000000c51e001
Arg3: 0000000000005878
Arg4: fffff70001080000

Debugging Details:
------------------


BUGCHECK_STR:  0x1a_41284

CUSTOMER_CRASH_COUNT:  1

DEFAULT_BUCKET_ID:  WIN7_DRIVER_FAULT

PROCESS_NAME:  iexplore.exe

CURRENT_IRQL:  0

LAST_CONTROL_TRANSFER:  from fffff80002f2e7e7 to fffff80002ed7c40

STACK_TEXT:
fffff880`0b0620c8 fffff800`02f2e7e7 : 00000000`0000001a 00000000`00041284 00000000`0c51e001 00000000`00005878 : nt!KeBugCheckEx
fffff880`0b0620d0 fffff800`02ef12f9 : fffffa80`03b073f8 ffffffff`ffffffff fffffa80`042638f0 ffffffff`ffffffff : nt! ?? ::FNODOBFM::`string'+0x4ad3
fffff880`0b062110 fffff800`02ecca4b : 87800000`629f9825 fffff680`000628f0 ffffffff`ffffffff 000fffff`ffffffff : nt!MiTerminateWsle+0x29
fffff880`0b062150 fffff800`02ec4192 : fffffa80`08926d80 fffff880`00000000 fffffa80`03b07060 fffffa80`03b073f8 : nt!MiDecommitPages+0x20b
fffff880`0b0629e0 fffff800`02ed6ed3 : ffffffff`ffffffff 00000000`0313e330 00000000`0313e328 00000000`00004000 : nt!NtFreeVirtualMemory+0x382
fffff880`0b062ae0 00000000`76f214fa : 00000000`00000000 00000000`00000000 00000000`00000000 00000000`00000000 : nt!KiSystemServiceCopyEnd+0x13
00000000`0313e2f8 00000000`00000000 : 00000000`00000000 00000000`00000000 00000000`00000000 00000000`00000000 : 0x76f214fa


STACK_COMMAND:  kb

FOLLOWUP_IP:
nt! ?? ::FNODOBFM::`string'+4ad3
fffff800`02f2e7e7 cc              int     3

SYMBOL_STACK_INDEX:  1

SYMBOL_NAME:  nt! ?? ::FNODOBFM::`string'+4ad3

FOLLOWUP_NAME:  MachineOwner

MODULE_NAME: nt

IMAGE_NAME:  ntkrnlmp.exe

DEBUG_FLR_IMAGE_TIMESTAMP:  50e79935

FAILURE_BUCKET_ID:  X64_0x1a_41284_nt!_??_::FNODOBFM::_string_+4ad3

BUCKET_ID:  X64_0x1a_41284_nt!_??_::FNODOBFM::_string_+4ad3

Followup: MachineOwner
---------
__________________
Mercatino: Utenti OK: Kaiser76, Bobosassa, veltosaar; |
|
|
|
|
30-03-2013, 08:40
|
#2352 |
|
Senior Member
Iscritto dal: Dec 2005
Messaggi: 501
|
Ciao a tutti,
io ho provato in tutti i modi,windws debugging tool sia x86 che 64m idem per i simboli, ma mi da questo errore: Codice:
Microsoft (R) Windows Debugger Version 6.2.9200.20512 X86
Copyright (c) Microsoft Corporation. All rights reserved.


Loading Dump File [C:\Users\BEATZIE\Desktop\blue screen\032913-27300-01.dmp]
Mini Kernel Dump File: Only registers and stack trace are available

Symbol search path is: C:\simboliretail330mbx86
Executable search path is:
Unable to load image \SystemRoot\system32\ntoskrnl.exe, Win32 error 0n2
*** WARNING: Unable to verify timestamp for ntoskrnl.exe
*** ERROR: Module load completed but symbols could not be loaded for ntoskrnl.exe
Windows 7 Kernel Version 7601 (Service Pack 1) MP (8 procs) Free x64
Product: WinNt, suite: TerminalServer SingleUserTS
Built by: 7601.18044.amd64fre.win7sp1_gdr.130104-1431
Machine Name:
Kernel base = 0xfffff800`0301e000 PsLoadedModuleList = 0xfffff800`03262670
Debug session time: Fri Mar 29 17:47:33.627 2013 (UTC + 1:00)
System Uptime: 0 days 0:00:19.642
Unable to load image \SystemRoot\system32\ntoskrnl.exe, Win32 error 0n2
*** WARNING: Unable to verify timestamp for ntoskrnl.exe
*** ERROR: Module load completed but symbols could not be loaded for ntoskrnl.exe
Loading Kernel Symbols
...............................................................
................................................................
.........
Loading User Symbols
Loading unloaded module list
....
*******************************************************************************
*                                                                             *
*                        Bugcheck Analysis                                    *
*                                                                             *
*******************************************************************************

Use !analyze -v to get detailed debugging information.

BugCheck F4, {3, fffffa8009b60b30, fffffa8009b60e10, fffff8000339b470}

*** WARNING: Unable to verify timestamp for mssmbios.sys
***** Kernel symbols are WRONG. Please fix symbols to do analysis.

----- ETW minidump data unavailable-----
unable to get nt!KiCurrentEtwBufferOffset
unable to get nt!KiCurrentEtwBufferBase
*************************************************************************
***                                                                   ***
***                                                                   ***
***    Either you specified an unqualified symbol, or your debugger   ***
***    doesn't have full symbol information.  Unqualified symbol      ***
***    resolution is turned off by default. Please either specify a   ***
***    fully qualified symbol module!symbolname, or enable resolution ***
***    of unqualified symbols by typing ".symopt- 100". Note that   ***
***    enabling unqualified symbol resolution with network symbol     ***
***    server shares in the symbol path may cause the debugger to     ***
***    appear to hang for long periods of time when an incorrect      ***
***    symbol name is typed or the network symbol server is down.     ***
***                                                                   ***
***    For some commands to work properly, your symbol path           ***
***    must point to .pdb files that have full type information.      ***
***                                                                   ***
***    Certain .pdb files (such as the public OS symbols) do not      ***
***    contain the required information.  Contact the group that      ***
***    provided you with these symbols if you need this command to    ***
***    work.                                                          ***
***                                                                   ***
***    Type referenced: nt!_KPRCB                                     ***
***                                                                   ***
*************************************************************************
*************************************************************************
***                                                                   ***
***                                                                   ***
***    Either you specified an unqualified symbol, or your debugger   ***
***    doesn't have full symbol information.  Unqualified symbol      ***
***    resolution is turned off by default. Please either specify a   ***
***    fully qualified symbol module!symbolname, or enable resolution ***
***    of unqualified symbols by typing ".symopt- 100". Note that   ***
***    enabling unqualified symbol resolution with network symbol     ***
***    server shares in the symbol path may cause the debugger to     ***
***    appear to hang for long periods of time when an incorrect      ***
***    symbol name is typed or the network symbol server is down.     ***
***                                                                   ***
***    For some commands to work properly, your symbol path           ***
***    must point to .pdb files that have full type information.      ***
***                                                                   ***
***    Certain .pdb files (such as the public OS symbols) do not      ***
***    contain the required information.  Contact the group that      ***
***    provided you with these symbols if you need this command to    ***
***    work.                                                          ***
***                                                                   ***
***    Type referenced: nt!_KPRCB                                     ***
***                                                                   ***
*************************************************************************
Probably caused by : wininit.exe

Followup: MachineOwner
---------
Ultima modifica di andr34 : 30-03-2013 alle 08:43. |
|
|
|
|
30-03-2013, 09:23
|
#2354 |
|
Senior Member
Iscritto dal: Dec 2005
Messaggi: 501
|
Grazie mille Eress, allego il file crash list in formato html (zippato)ottenuto con BlueScreenView.che io però non saprei decifrare.
ora esco tornerò dopo pranzo, ciao ciao Ultima modifica di andr34 : 18-03-2015 alle 10:15. |
|
|
|
|
30-03-2013, 09:45
|
#2355 | |
|
Senior Member
Iscritto dal: Jul 2010
Messaggi: 9326
|
Quote:
Per l'hard disk usa CrystalDiskInfo. Posta uno screenshot. Per la ram usa Memtest86+. Completa 4/5 pass e posta il risultato.
__________________
[CASE Cooler Master Silencio 550]-[MOBO Asrock Z68 Pro3]-[CPU Intel Core i7-2600K]-[RAM 8GB G.Skill]-[HDD 1TB Samsung + 320GB Samsung + 500GB Maxtor]-[VGA Zotac Geforce GTX 560 Ti]-[MASTERIZZATORE Samsung SH-S222AB][S.O. Windows 7 64 bit] |
|
|
|
|
|
30-03-2013, 11:56
|
#2356 |
|
Senior Member
Iscritto dal: Dec 2005
Messaggi: 501
|
Grazie Blue,
allego lo screenshot di CrystalDiskInfo , è sufficiente quanto è scritto li? o devo allegare altro? a breve metterò anche l'esito di memtest, oggi ho un po di impegni e sarò fuori casa al massimo lo farò domani il test. grazie ancora Ultima modifica di andr34 : 18-03-2015 alle 10:15. |
|
|
|
|
31-03-2013, 16:13
|
#2358 |
|
Senior Member
Iscritto dal: Dec 2005
Messaggi: 501
|
sono al 3 pass, dopo 3 ore e rotti, non ha trovato nessun errore. lo lascio continuare ancora un po ma ho la sensazione che la ram sia a posto.
secondo me è qualche cos'altro. anche oggi no è uscita la scermata blu ma ho dovuto riavviare due o tre volte prima di riuscire a usare windows, perchè al riavvio è tutto bloccato, il mouse funziona ma i menu non sia aprono, idem se faccio doppio clic su un file non si apre, in basso a destra risco a apreire il menu della risorse di rete ma se clicco su connetti a internet per esempio non parte, è come non fare clic insomma. altre volte invece si pianta del tutto , sempre al riavvio e devo togliere l'alimentazione. Questo per dire che i problemi non sono solo con la schermata blu che comunque secondo me è collegata agli altri problemi. screeenshot di memtest allo stato attuale: Aggiornamento: finito terzo pass e ancora nessun errore 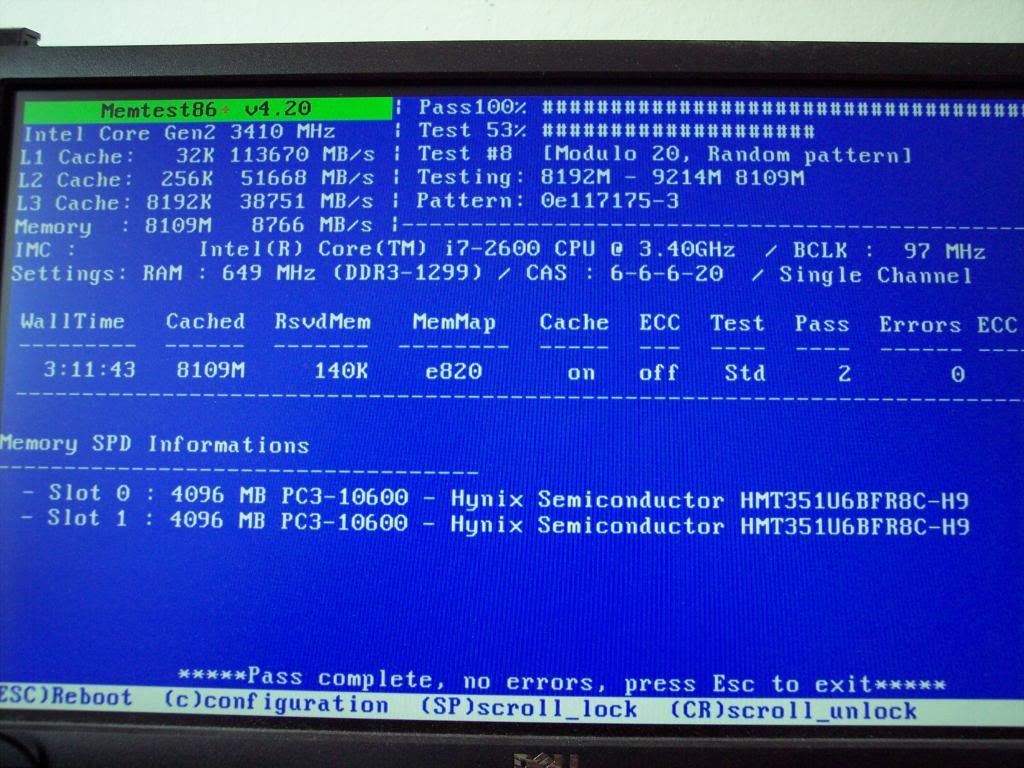
Ultima modifica di andr34 : 31-03-2013 alle 16:41. |
|
|
|
|
31-03-2013, 16:50
|
#2359 |
|
Senior Member
Iscritto dal: Dec 2005
Messaggi: 501
|
dimenticavo, non so se è pertinente, una volta quando non riuscivo a riavviare ( o meglio riavviava ma poi non riuscivo a usare windows) dopo una serie di fallimenti ho spendo il router di Alice e ha riavviato. E' in vecchio router sia usb che con presa di rete che io uso collegato tramite cavo di rete perchè non esisto piu i driver USB per windows 7. Però non ha mai dato problemi prima e ho sempre usato quello.
Edit: finito 4° pass nessun errore Edit: finito anche 5 pass nessun errore Ultima modifica di andr34 : 31-03-2013 alle 19:08. |
|
|
|
|
02-04-2013, 18:35
|
#2360 |
|
Senior Member
Iscritto dal: Jun 2001
Città: Cosenza
Messaggi: 2441
|
ragazzi, un hdd rilevato come non "in buona salute" da vari programmi di test, può provocare dei BSOD? l'hdd non è di sistema ma ci accede spesso perchè è utilizzato per file sharing.....grazie.
__________________
Intel I7 3820@4.3Ghz ° Gigabyte x79 UP4 ° CORSAIR DDR3 32GB Dominator ° Zotac GTX980 Amp! ° SSD Samsung 850 EVO 256GB - Samsung 840 Evo 256GB - Seagate Barracuda 2TB ° Creative X-Fi Titanium Fatal1ty ° Enermax Infinity 720w ° Corsair Graphite 600T ° Asus ROG SWIFT ° AKG 272HD |
|
|
|
|
|
| Strumenti | |


|
|

Tutti gli orari sono GMT +1. Ora sono le: 07:08.

_XXL.jpg)